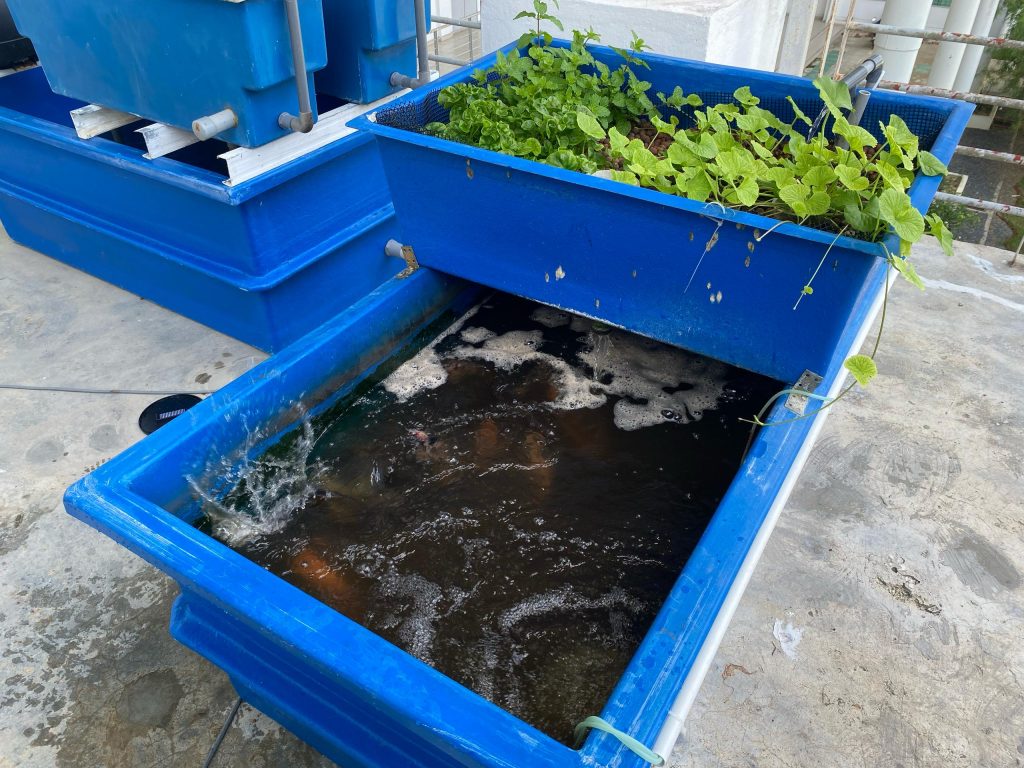
We summarize the water quality measurements collected between 09:00 and 12:00 on March 10, 2025. The data reveals several notable patterns in key parameters:
Electrical conductivity (EC) measurements showed variability throughout the monitoring period, beginning at 3556 µS/cm at 09:00, decreasing to 3329 µS/cm by 11:00, before rising to 3489 µS/cm at 12:00. This fluctuation suggests dynamic changes in water composition during the observation window.
pH values remained within a stable range of 6.11 to 6.33, demonstrating a slight but consistent increase from morning to midday. The temperature profile followed expected diurnal patterns, rising from 27.8°C to a peak of 30.1°C at 11:00 before a minor decrease to 29.6°C by 12:00.
A notable observation was the constant total dissolved solids (TDS) reading of 1775 ppm across all measurement times. The calculated EC/TDS ratio of approximately 2.0 exceeds typical values observed in natural water systems, potentially indicating anthropogenic influence.
These findings suggest generally stable water conditions during the monitoring period, though the elevated EC/TDS ratio warrants further investigation. Additional sampling at this location is recommended to determine whether these characteristics represent normal conditions or require mitigation measures.
| DateTime | Time (HH:MM) | EC (us/cm) | pH | Temperature (°C) | TDS (PPM) |
| 10/3/2025 9:00 | 9:00 | 3556 | 6.11 | 27.8 | 1775 |
| 10/3/2025 10:00 | 10:00 | 3464 | 6.31 | 29.8 | 1775 |
| 10/3/2025 11:00 | 11:00 | 3329 | 6.28 | 30.1 | 1775 |
| 10/3/2025 12:00 | 12:00 | 3489 | 6.33 | 29.6 | 1775 |